Biomonitoring of Atmospheric Pollution - what does it mean?
Living organisms can be used as bioindicators/biomonitors for observing the impact of the environment especially related to trace elements, organic compounds and radionuclides*
 Smog over Almaty City (Kazakhstan) - picture taken during a temperature inversion (from Igor Jefimovis).
Our world ungergoes rapid changes and is faced with an increasing number of known and unknown pollutants which combine with climate change and losses of biodiversity to threaten almost all ecosystems. This complex system of interactions and interrelations requires intensified efforts to provide integrated information on the status and development of environmental quality. Bioindicators and biomonitors have proven to be excellent tools in many of these cases and could provide information which cannot be derived from technical measurements alone.
Bioindicators & biomonitors yield extensive information. Thus an increasing knowledge of ecology gave way to the insight that organisms, cells and subcellular compounds likewise can be used as indicators for ecosystem qualities and for assessment of the impact of environmental stress on the composition and functioning of ecosystems. Indicators can be used to assess (environmental) quality, but also to investigate trends., e.g. by monitoring systems with measurements repeated in time.
To give an insight into this highly interesting research area of Bioindicators & Biomonitors (introduction, definitions, instrumental analysis of chemical elements, examples for biomonitoring) will be given by Prof. Dr. Bernd Markert.
In general there is given a well known definition by Market et al. (1997) what Bioindication & Biomonitoring is about:
Bioindication
- is the use of organisms to obtain a relative information on the quality of the environment
Biomonitoring
- is to obtain an information on the quantity of the quality of the environment (absolute data, obtained by mass balances for instance).
BioMAP aims at giving a state-of-the-art overview
of the current knowledge of how and where
organisms can be used to assess
environmental and ecosystems qualities.
Examples
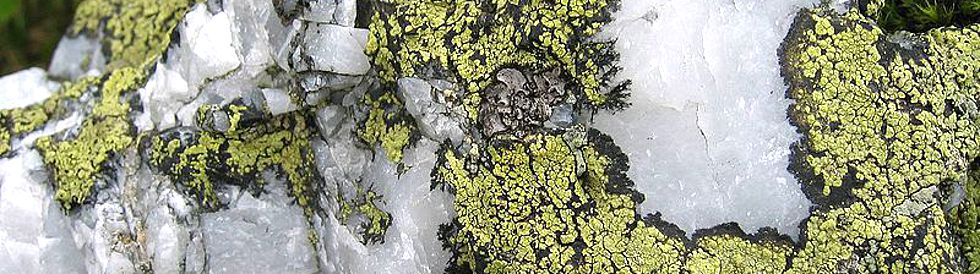
Mosses and lichens as biomonitors and their use in air pollution studies
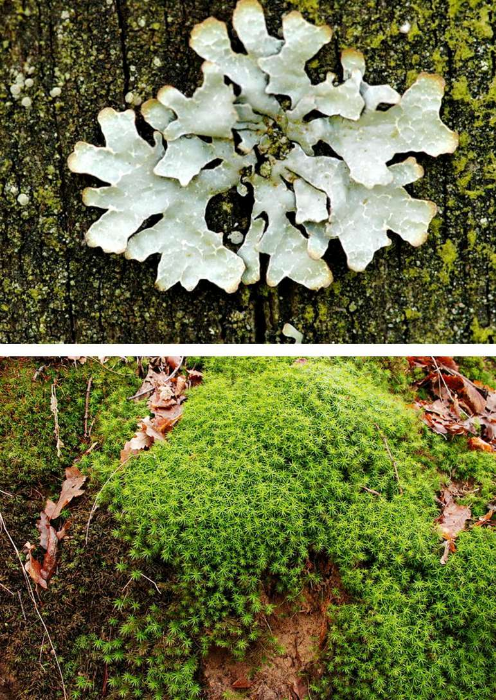 Biomonitors i.a.: Lichens (Parmelia sulcata), mosses (Polytrichum formosum).
Mosses represent one of the simplest forms of terrestrial plants. This is directly connected with the peculiarities of their water metabolism. The dominant phase of the bryophyte life cycle is represented by gametophyte generation. Consequently, evolution of structural complexity has been partly limited by the dependence of sexual reproduction on free water for the dispersal of the motile antherozoids.
For some ten years now, epiphytic or epigeic plants – mostly mosses and lichens, but also Bromeliaceae (Tillandsia) in Latin America – are being employed as bioindicators, their use being accepted not only in the scientific community but also among political or economic authorities in both Europe and Southern America (Bargagli 1998; Freitas et al. 2000; Pignata et al. 2002; Zechmeister et al. 2003; Markert et al. 2004). This state of matters differs from those in other countries and continents (China, Australia- North America) where plant-based biomonitoring was developed for scientific purposes or on regional rather than national scales (only). Thus no comprehensive description may be given but one has to consider unlike developments of these techniques (Zechmeister 1995; Djingova & Kuleff 2000; Garty 2000a, 2000b; Herpin et al. 2001; Wolterbeek 2002; Djingova et al. 2003, Fränzle O 2003).
This high diversity in developments of bioindication and biomonitoring was not produced arbitrarily but owes to fundamental (and thus acceptable!) reasons (Markert et al. 2008):
- historical ones, with corresponding methods spreading from Scandinavia via Europe to the rest of the world;
- geographical, climatic and geogenic distinctions which influence each living organism and population (hard skills);
- different mental and psychological attitudes depending on intercultural attitudes among scientists of different origins who encounter each other e.g. in international meetings for harmonization and procedures (soft skills).
Results from chemical analysis are converted into multi-color maps (s. figure) of pollution using geographic information systems (GIS), providing maps such as that for lead (moss samples were taken from 1990-1992).
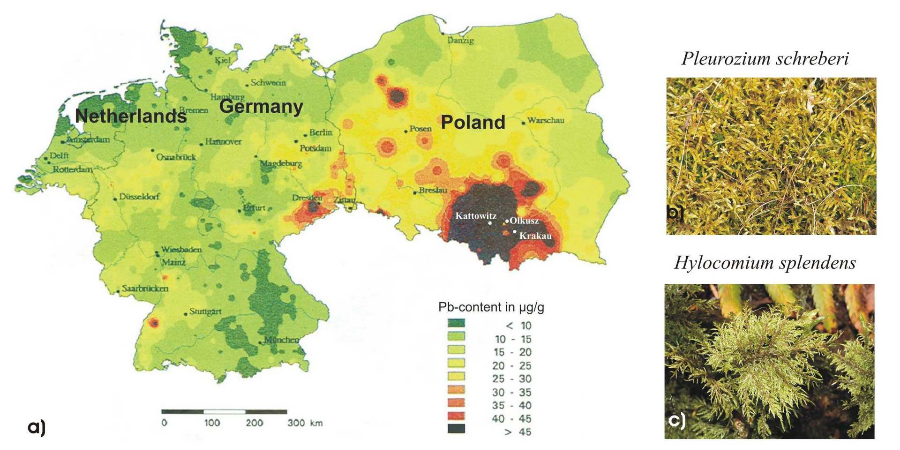
Figure: (a) This map gives Pb contents in moss species from different countries (Netherlands, Germany, Poland), using moss samples taken during 1990-1992 (Herpin et al. 1996). (b, c) Mosses [only two moss species of a total of four of the overall European program are shown as examples: Pleurozium schreberi (b) and Hylocomium splendens (c)] are bioindicators / biomonitors for controlling the atmospheric deposition of different chemical elements.
As final output of such investigations bioindication results compare relative (analytical) data of (element) concentrations given by bioindicator species (mosses). In this example the mosses are represented by different locations around Middle Europe. Same can be done by using bioindicator to get an impression on behavoiur of chemicals by time. As example is given for Pb in mosses (Polytrichum formosum) collected over some years.
Spanish moss Tillandsia usneoides L. for atmospheric pollution measurements
- in megacities like São Paulo, Brazil (Markert et a. 2011)
 São Paulo, Brazil
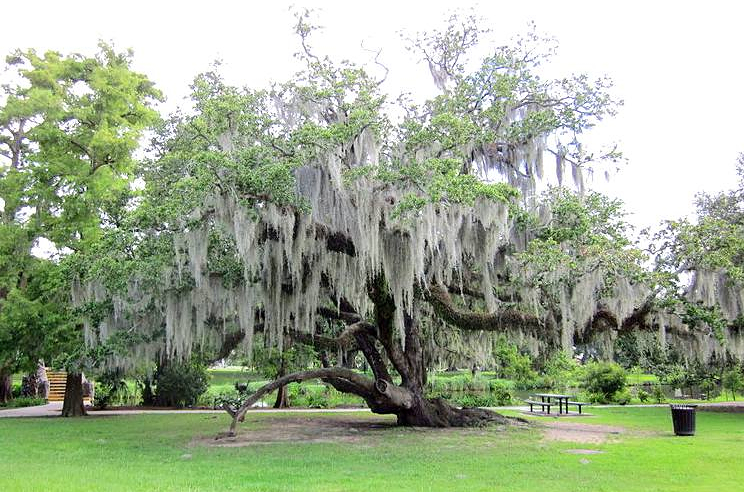 City Park, New Orleans, old live oak tree with Spanish Moss (Tillandsia usneoides L., photo from wikipedea)
In the past 10 years more and more activities were undertaken to transfer the bioindication method into the pollution control observations of so called megacities like São Paulo (Figueiredo et al. 2001, 2007; Markert et al. 2011) having around 20 million inhabitants.
For this reason Tillandsia usneoides L., an epiphytic bromeliad plant, was chosen, because this plant is able to absorb water and nutrients directly from the air.
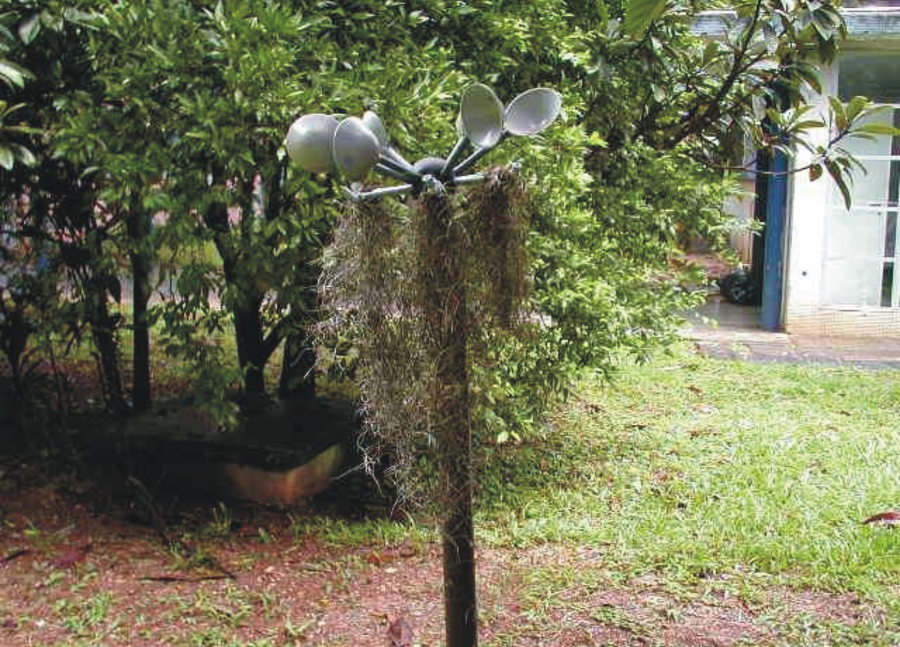 Biomonitor Tillandsia for monitoring the atmosperhic pollution in megacities like São Paulo (photo by A. Figueiredo)
Five consecutive transplantation experiments (8 weeks each) were performed in 10 sites of the city, submitted to different sources of air pollution (industrial, vehicular), using plants collected from an unpolluted area. After exposure, trace metals were analyzed in the plant by instrumental neutron activation analysis. Distribution maps were drawn, which demonstrate that traffic related elements such as Zn and Ba presented high concentrations in exposure sites near to heavy traffic avenues (cars, buses and trucks) and may associated to vehicular sources (Ribeiro et al., 2012).
*"Bioindicators & Biomonitors - Principles, Concepts and Applications", Markert et al. 2003
(eds.), Elsevier. See further information on the webpage of the EISN-Institute.

Dr. Emina Rmic (BA), Dr. Simone Wünschmann (DE), Dr. Sabina Zero (BA)